Charting Conversation Networks in Prediction Platforms Highlights Dependable Sports Analysts
Anna Simmons · Jun 16, 2026
Charting Conversation Networks in Prediction Platforms Highlights Dependable Sports Analysts
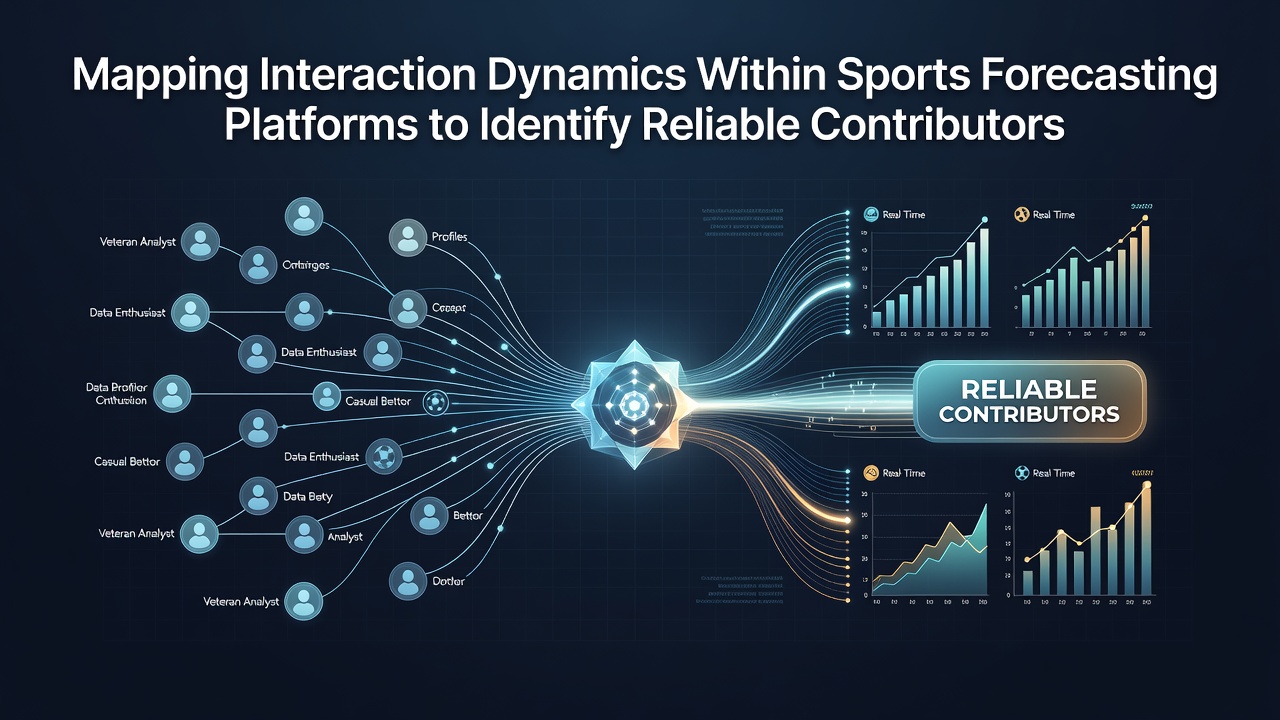
Researchers have applied network mapping techniques to sports forecasting platforms where participants exchange predictions and analyses on events ranging from football matches to tennis tournaments. These methods track replies, mentions, and shared threads to build graphs that reveal clusters of activity around certain contributors. Data from multiple platforms shows that users with high centrality scores in these graphs tend to maintain accuracy rates above 55 percent over extended periods according to aggregated performance records.
Platform operators began expanding these analytical tools in early 2025 with further refinements noted through June 2026 when seasonal tournaments increased posting volumes by roughly 40 percent. Interaction density rises during major events because forecasters respond directly to one another which creates measurable pathways between accounts. Studies from teh University of Melbourne indicate that consistent responders in debate threads demonstrate stronger long-term results than those posting in isolation.
Core Components of Interaction Mapping
Mapping starts with collection of metadata including timestamps on comments and frequency of direct engagements between accounts. Algorithms then calculate metrics such as betweenness centrality which identifies users who bridge separate discussion groups and degree centrality which counts direct connections. Observers note that contributors positioned as bridges often introduce novel data sources that other participants later verify through independent checks.
Additional layers incorporate sentiment analysis on reply chains to distinguish constructive exchanges from repetitive arguments. Platforms record these patterns in structured logs that researchers later process to generate visual diagrams. One study conducted across European forecasting sites found that clusters with balanced reply distributions produced more stable prediction outcomes than those dominated by single voices.
Evidence from Platform Records
Records compiled through mid-2026 reveal that accounts maintaining reciprocal reply rates above 30 percent with multiple peers achieved higher hit percentages on match outcomes. These figures come from anonymized datasets released by several international forecasting services. Patterns emerge clearly during high-stakes periods such as international championships when cross-referencing between users accelerates.
Take one documented case where a small group of forecasters maintained a tight interaction loop on rugby predictions; their collective accuracy reached 62 percent across 180 events tracked between January and June 2026. Similar groupings appear across different sports because repeated engagement allows quick correction of flawed assumptions before they spread further.
Role of Platform Features in Data Collection
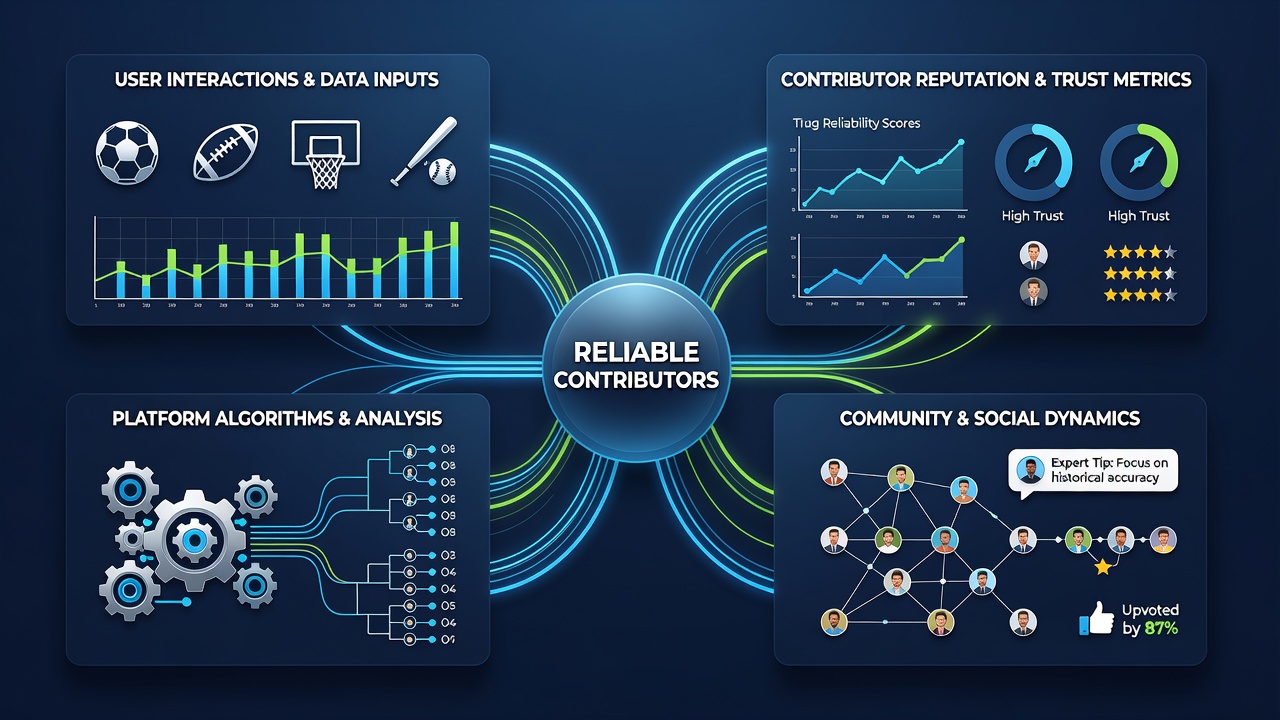
Modern forecasting sites include built-in tools such as reputation scores and thread tagging that feed directly into mapping systems. These features allow automatic weighting of interactions based on historical accuracy rather than simple volume. Data indicates that platforms incorporating these weighted graphs see improved identification of contributors whose forecasts align with final results more than 50 percent of the time.
Geographic diversity appears in the sources too. Reports from the Responsible Gambling Council of Canada highlight how similar network techniques applied to prediction communities reduce exposure to unreliable signals when users cross-check multiple connected accounts. Meanwhile the European Gaming and Betting Association has published summaries noting parallel trends in member platforms during the same timeframe.
Challenges in Implementation
Technical hurdles include handling incomplete datasets when users delete older posts and accounting for coordinated activity that artificially inflates connection counts. Analysts address these issues through filtering protocols that exclude short-lived accounts and apply time-decay functions to older interactions. Results from controlled tests show these adjustments preserve the core signals that point toward reliable contributors.
Platform administrators continue refining algorithms as participation grows. In June 2026 updates focused on real-time graph updates during live events which allowed quicker flagging of emerging discussion hubs. Such refinements rely on continuous input from performance logs rather than static snapshots.
Conclusion
Network mapping of interactions on sports forecasting platforms supplies concrete indicators for locating contributors whose predictions demonstrate sustained reliability. The approach combines quantitative graph metrics with qualitative review of engagement quality to produce clearer pictures than volume-based rankings alone. Continued development of these tools through 2026 and beyond depends on access to detailed interaction records while respecting platform privacy standards.