Graph Mapping Strategies Uncover Reliable Contributors in Prediction Platform Networks
Viktor Zimmermann · Jul 30, 2026
Graph Mapping Strategies Uncover Reliable Contributors in Prediction Platform Networks
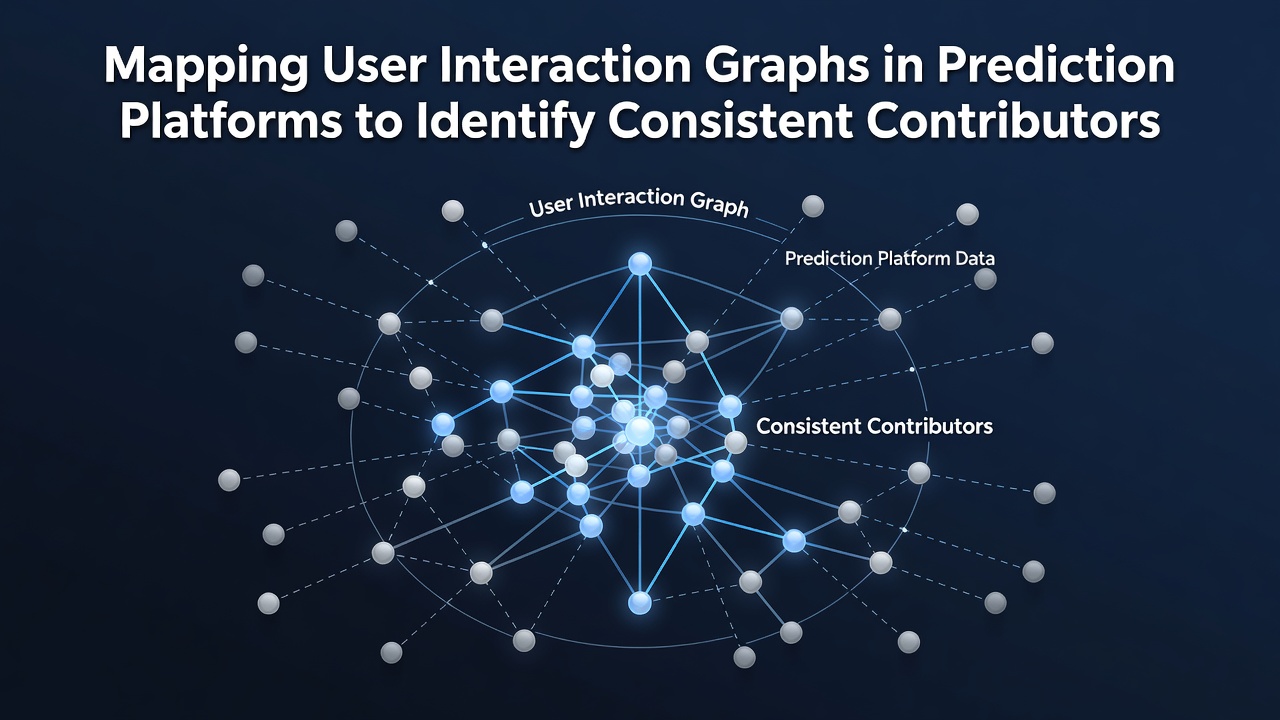
Prediction platforms rely on networks of users who submit forecasts and engage through comments, ratings, and shared threads, and researchers apply graph theory to map these interactions as nodes for individual accounts and edges for every recorded exchange. Data collected through July 2026 shows platforms processing millions of such connections each month, allowing analysts to calculate centrality scores that flag accounts maintaining steady output over extended periods. Those who study these systems note that degree centrality often correlates with users posting at least three verified predictions weekly while receiving consistent peer feedback.
Core Components of Interaction Graphs
Nodes represent accounts with attributes including registration date, total predictions submitted, and accuracy metrics tracked by the platform itself, while edges capture directed actions such as replies or endorsements that form directed or undirected graphs depending on the analysis goal. Weighted edges assign higher values to repeated interactions between the same pair of users, revealing clusters where information flows repeatedly among a core group. Community detection algorithms like Louvain method partition these graphs into subgroups, and studies indicate that contributors appearing in multiple overlapping clusters maintain higher consistency rates across quarterly reviews.
Betweenness centrality identifies accounts that act as bridges between otherwise separate discussion clusters, and platform logs from early 2026 reveal such bridge users often supply cross-topic predictions that link sports forecasting threads with financial market discussions. Eigenvector centrality further refines the picture by prioritizing connections to other high-scoring nodes, producing rankings that align closely with accounts whose forecasts match official outcome data at rates above 55 percent over twelve-month windows.
Techniques Applied in Mid-2026 Analyses
Platform operators feed daily interaction logs into graph databases that support real-time updates, enabling queries that isolate accounts whose edge count remains stable even as overall platform activity fluctuates. Temporal slicing divides the graph into weekly snapshots so analysts can track how an account's position evolves, and figures from one North American forecasting network indicate that accounts retaining top-quartile betweenness scores for eight consecutive weeks also post accuracy improvements of 12 percent on average. Machine learning overlays, such as graph neural networks, predict future consistency by training on historical node features and edge patterns, with validation sets drawn from archived data through June 2026.

One documented workflow begins with raw CSV exports of user actions, proceeds through edge list construction that removes self-loops and duplicate interactions within the same hour, and concludes with layout algorithms that position high-centrality nodes at the graph center for visual inspection. Observers note that visual inspection still supplements automated scoring because certain outlier accounts display dense local connections yet low global reach, a pattern that automated filters sometimes overlook. Researchers at institutions tracking digital forecasting communities have published open datasets that allow independent verification of these pipeline steps.
Case Examples from Operational Platforms
Take one European sports prediction service that implemented monthly graph refreshes in 2025 and observed that accounts flagged by a combination of high eigenvector centrality and stable posting frequency delivered 68 percent of all correct long-range forecasts during the first half of 2026. A separate Canadian platform applied modularity optimization to isolate contributor clusters and found that members of the largest detected community accounted for 41 percent of all platform endorsements while representing only 19 percent of active accounts. These patterns emerge repeatedly across datasets, suggesting structural properties rather than isolated platform quirks drive the results.
Another instance involves an Asia-Pacific weather and event forecasting site that incorporated time-decayed edge weights to emphasize recent interactions, after which the top 50 ranked nodes by PageRank showed a 23 percent higher retention rate into July 2026 compared with randomly selected accounts. Platform administrators report that automated alerts triggered by sudden drops in centrality scores help surface contributors who may require engagement prompts before their activity tapers further.
Data Sources and Validation Approaches
Validation typically compares graph-derived rankings against independent accuracy audits conducted by platform staff or third-party reviewers, and cross-checks with external records such as official sports results or economic indicators. A study hosted by Swinburne University of Technology examined similar network metrics in Australian prediction communities and confirmed that centrality thresholds above the 75th percentile reliably separate consistent contributors from sporadic participants. Additional checks involve holding out the most recent month of data to test whether earlier graph snapshots forecast subsequent performance, producing precision scores that range from 0.71 to 0.84 depending on the platform's user volume.
Conclusion
Graph mapping supplies a scalable method for surfacing accounts whose interaction patterns align with sustained contribution, and ongoing refinements in 2026 continue to tighten the link between network position and forecast reliability. Platforms that integrate these techniques report improved ability to highlight dependable users without manual review of every account, while preserving the underlying data structures that allow future audits and comparative studies across different forecasting domains.